The Community Innovation Survey allows to compare innovation and competiveness of firms, industries, and countries across Europe. It includes EU member states and Iceland, Norway, Croatia, Serbia and Turkey (with some exceptions across the seven waves). In here, we consider the last five waves (i.e. 2004-2012) for a most comprehensive picture, since in 2004 new member states were included in the survey.[1]
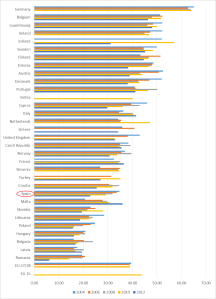
In the period considered, more than 700,000 companies participated in the survey each year; of these, about one-third declared to have undertook innovation activities[2]. Countries differ significantly in terms of the innovation behaviour of their firms. Fig. 1 shows the share of innovative enterprises on total enterprises by country and wave, ordered by the average shares over the four waves. The average share of innovative firms ranges from the highest one of Germany (64%) to the lowest one of Romania (16%). Spain occupies the second half of the ranking, with an average share of innovative firms of 30%. Such variety is pervasive also in terms of the trend across the years. In particular, Spain shows a decreasing pattern; in 2004, the share of innovative firms is 35%, while in the last wave drops to 23%. Similar declining trends are shown by Poland and Estonia, while Malta is the only country with increasing shares; the remaining countries exhibit more fluctuating trends over the years.
Fig. 1 – Share of innovative firms on total firms
Source: EUROSTAT, Community Innovation Survey
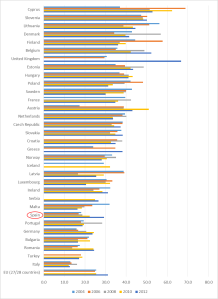
R&D cooperation among EU countries concerns about one-quarter of innovative firms (average on the four waves). Fig. 2 shows the shares of cooperative innovative firms by country and wave. The country ranking lowest is Italy (13%), while Cyprus is the country with the highest share (54%). In the last two waves, the percentage of cooperative innovative firms of EU members increase from 25% in 2010 to 31% in 2012. Spain collocates among the bottom rows with an average share of 21%. Spain is among the countries which significantly increase the share of cooperative innovative firms in the latest years, from 22% in 2010 to 29% in 2012; similarly, Belgium increases its share from 42% in 2010 to 52% in 2012, while other countries experience a decline instead, such as for example Luxembourg (from 32% in 2010 to 20% in 2012). However, likewise the statistics on the share of innovative firms discussed above, the shares of cooperative innovative firms for each country tend to fluctuate over time. In the case of Spain, the combination of a decrease in the share of innovative firms as discussed above and an increase of the share of cooperative innovative firms signal a possible reinforcement of the links between technological cooperation and innovativeness, meaning that the firms which manage to be innovative are also cooperating to a significant extent.
Fig. 2 – Share of innovative firms with any type of cooperation
Source: EUROSTAT, Community Innovation Survey
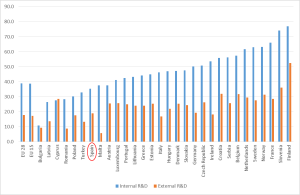
Firms rely on both internal and external sources of knowledge to sustain their competitive advantage. With respect to R&D expenditures, the Community Innovation Survey provides data for in-house R&D and external R&D (i.e. R&D contracted out to other enterprises or research organisations). Fig. 3 shows the shares of innovative firms with internal and external R&D by country, averaged on the period 2004-2012. Firms from EU-28 countries which are engaged in internal R&D constitute 39% of innovative firms, while only 18% of innovative firms carry out external R&D. For internal R&D, Bulgaria has the lowest share (11%), while Finland ranks at the top (77%). In terms of external R&D, the lowest share belongs to Malta (6%), while Finland has the highest one (32%). Spain stays in the bottom-half of the ranking, both in terms of internal R&D (35%) and external R&D (19%), although the latter is slightly higher than EU-28 average.
Fig. 3 – Average shares of innovative firms with internal and external R&D, 2004-2012
Source: EUROSTAT, Community Innovation Survey
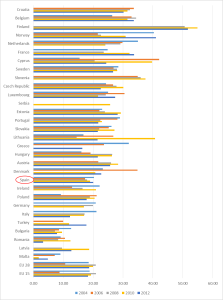
By looking at the trends over the period 2004-2012, the shares of innovative firms with internal R&D in Spain vary across time as shown in Fig. 4, with the highest figure registered in 2012 (41%), about two percentage-points above EU-28 countries in the same year. About the trends of external R&D showed in Fig. 5, Spain experiences a lower point in 2004, and then a steady increase until 2012, where the percentage of innovative firms with external R&D reaches the same level as in 2004. The increase of both internal and external R&D in the latest years suggests an intensification of the linkage between R&D expenditures and innovation for Spanish firms; if we consider the decreasing trend of the share of innovative firms in the period considered, this suggests that for the firms which manage to stay (or start to be) innovative, R&D remains an important source of knowledge.
Fig. 4 – Share of innovative firms with internal R&D, 2004-2012
Source: EUROSTAT, Community Innovation Survey
Fig. 5 – Share of innovative firms with external R&D, 2004-2012
Source: EUROSTAT, Community Innovation Survey
[1] We consider the following core innovative sectors for 2004-2006: Mining and Quarrying; Manufacturing; Electricity, gas, water supply; Transport, storage and communication; Financial Intermediation; Wholesale trade and commission trade, except of motor vehicles and motorcycles; Computer and related activities; Architectural and engineering activities and related technical consultancy; Technical testing and analysis. For 2008-2012: Mining and Quarrying; Manufacturing; Electricity, gas, steam and air conditioning supply; Water supply, sewerage, waste management and remediation activities; Wholesale trade, except of motor vehicles and motorcycles; Transportation and storage; Publishing activities, Telecommunications, Computer programming, consultancy and related activities, Information service activities; Financial and insurance activities; Architectural and engineering activities; technical testing and analysis.
[2] Innovative firms are those which have product or/and process innovation, regardless of organisational or marketing innovation, including enterprises with abandoned/suspended or on-going innovation activities.


